Getting Started with Littlefield Technologies
Introduction
Littlefield Technologies is an electronics job shop producing Digital Satellite System receivers. Other manufacturers use these receivers as sub-assemblies of more complex products. There are several competing companies. Littlefield’s differentiation strategy emphasizes guaranteed lead times in return for premium prices. Their guarantee offers rebates to all customers whose orders are delivered after the quoted lead time, and they deliver all orders that exceed the maximum lead time for free.
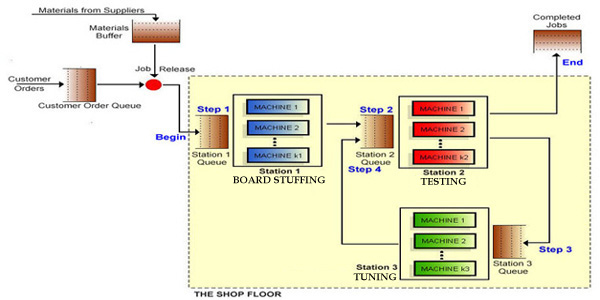
Littlefield assembles its DSS receivers from kits of electronic components obtained from a reliable supplier. The assembly process consists of four steps carried out at three stations called the board stuffing, testing and tuning stations. A graphic representation of Littlefield’s process appears in Figure 1. The first step consists of mounting and soldering electronic components onto PC boards at the board stuffing station. The second step collects test data on each receiver that is transmitted to tuning for the third step. The third step tunes the DSS units to receive satellite signals at the tuning station. The final step returns boards to the testing station to for a final burn-in and certification required by customers. There is no loss or rework at the Testing station.
Figure1
All stations are composed of fully automated machines. You will have some cash on hand when the assignment begins. This amount is depleted by both capacity and inventory purchases. Revenues earned from filled orders increase the cash balance. Cash held earns interest, compounded every simulated day, at an effective annual rate of 10%. There are no taxes, salaries, nor fixed overhead costs.
Registering your team
You will need to create and register your team before the simulation begins. Your instructor will provide a web address and the required codeword. Each team must invent a unique name and password that contains only lower-case letters or numbers. The registration webpage is shown below.
On the start page, enter your codeword and click the OK button. On the subsequent page, enter your team’s name and password. After creating the team, you will be able to enter your team’s membership roster. You may use upper case letters in all student names but please do not include any special characters, hyphenation or apostrophes. If your instructor has provided a section ID, it is entered in the small field at the top of the page. Depending on how your game is set up, you may also be required to enter an individual code next to your name. Your team is registered once this information is submitted. You may edit the team’s name, password, or membership by returning to your registration page and changing the appropriate fields. To delete a team, erase all team members and submit an empty team. You will not be able to reenter this web page after the simulation begins.
Accessing your factory
You will access your factory from the entry webpage by entering your team name and password. Your instructor will provide the web address. Opening that link will give the login window shown below.
Please allow pop ups.
Using the simulator
This web-based simulator runs continuously. That is, if you view the site at 10 am, and then view it again at 11 am on the same day, you will notice some simulated time has elapsed. You have no control over the simulator’s clock. You may need to wait several simulated days to see the effects of your actions. Constant monitoring is not necessary to success.
Information specific to your particular assignment will be distributed prior to the simulation. The information will specify variables and actions, which determine your factory’s performance. You may access your factory at any time of day. When the assignment ends, your factory will quickly run the final simulated days and return to a suspended state. You may check the ending status of your factory and download historic data after the simulation ends but your factory will no longer be active.
Your factory’s web page shows a schematic diagram of the job shop floor illustrated in Figure 1. Clicking icons in the schematic will reveal menus that control your factory and provide historic data. For example, clicking on a station icon will reveal a menu that gives data about that station, as well as buttons for additional menus that allow machine purchases or viewing a plot of the station’s historic utilization rates. The specific information available at each icon is listed on the last page of this document.
Your factory’s status is automatically updated upon login. To update the factory status at other times click the update button on the bottom of the web page. In light of the slow speed of the simulator, there will be no point to frequent updates.
You should download factory data sets for in-depth spreadsheet analysis. Below each plot you will find a download button. Clicking this button will initiate a download of the tab-delimited text file containing the plotted data. Save this file to your desktop or other useful location, and open the file with a spreadsheet application like Excel.
Data points are recorded at the start of each day. In the Materials Buffer plot, fractional days are also included to show the exact time new materials orders arrive and the exact time inventory reaches zero.
You may notice a few days where zero jobs exit the factory. On such days, the daily average lead time and daily average revenues are meaningless. A value of zero will appear in those plots on those days.
The winning team is the team with the highest cash balance at the end of the game. You can compare the cash status of your team to other teams by clicking the Overall Standing button below the factory schematic.
Icons on the Littlefield Technologies web page:
| ICON | INFORMATION AVAILABLE |
|---|---|
| Order Queue: |
|
| Materials Buffer: |
|
Station Queues: |
|
Stations: |
|
| Completed Jobs: |
|
Clicking on the above icons will enable changes to certain features of the factory. Your assignment handout will explain which features you may change.

Sources and uses of cash may be obtained by clicking the cash button in the factory control bar. Sources of cash are revenue, machine scrap value, and interest. Uses of cash are raw materials inventory and capacity purchases. Clicking the history button will reveal team actions. Clicking the update button will refresh your screen. Clicking the quit button will exit the factory. Clicking the overall standing button will show your team’s relative rank.

